Introduction to 10,000 Broiler Farm Project Report
Hello,
My name is Temi Cole, the author of The Big Book Project.
Whilst there are many broiler farm project reports published online,
I decided to publish this one to give you 3 unique benefits (brand new – just for you):
- A comparison ROI (return on investment) outcome using 4+1 broiler rearing model
- …all other broiler project reports seen online used All-In-All-Out rearing.
- Guide notes to help you understand the workings of any poultry project report
- Give you a PDF to print off and study later (click the big orange button above).
So if you are looking for a detailed sample broiler farm project report AND analysis,
(Using a multi-flock, high cash flow rearing model)
This is it!
A little hint…
P.S.
In case the thought crosses your mind, this report was produced using Poultry Project Reporter software.
It’s a custom-built, web-based automatic poultry project report writer.
I exclusively built and use this software to write all my consultancy project reports.
Why?
To save me time (and money)…PLUS, to produce the most detailed reports anywhere.
And it does just that.
It’s:
- accurate,
- quick,
- & easy
Because of it, I am now able to produce the most detailed poultry project reports that I have seen anywhere online…
…literally taking minutes to calculate complex proposals that otherwise would take weeks to write.
(I wouldn’t dream of doing it any other way now. And yes, I recommend it.)
Contents
- Introduction to 10,000 Broiler Farm Project Report
- How I Put This Report Together
- Things To Keep In Mind When Reading This Broiler Farm Project Report
- Assumptions
- Indian Government Subsidies For Poultry Farming Projects
- A quick note on broiler housing
- Economics of broiler farming to with a production capacity of 10,000 birds (using 4+1 rearing model)
- But why a negative net present value? That isn’t good, is it?
- Now, over to you…
How I Put This Report Together
I worked out this broiler farming project report using these methods and conditions:
- It’s based in India. (So all prices are quoted in Indian Rupees.)
- I loosely based the report on data input prices and costs from 6 source publications:
- Odishavet.com (Dr. Ashesa Kuamar Kar – a veterinary officer with the Government of Odisha, in Subarnapur district)
- Dr. Vishnu Vardhan Reddy Pulimi – Animal Nutritionist, Dairy Consultant and Veterinary Assistant Surgeon (VAS) at Government of Andhra Pradesh
- Krishi Vigyan Kendra (Kendrapara, Odisha) Agricultural Extension
- Tamil Nadu Agricultural University
- Vikaspedia.in – part of the national level initiative – India Development Gateway (InDG)
- NABARD (India) National Bank of Agriculture and Rural Development
- …this was because they are credible sources of Indian based poultry project research. (No point in reinventing the wheel. These are currently the gold standard online.)
Things To Keep In Mind When Reading This Broiler Farm Project Report
I must remind you that these conditions should be kept constant when interpreting:
- Commercial strain broiler birds, which consistently will be used for every batch.
- The sale prices and cost prices, of course, are subject to change – driven by market forces.
- Strict biosecurity and husbandry methods should be followed to maintain optimum broiler flock performance.
Pro tip: I recently launched a custom resource library called Poultry Project Hub.
The aim is to help you understand EXACTLY how to write a winning broiler farm project report.
It has over 20,501 words, 200+ rows of data tables, as well as 30+ screenshots/images, sample calculations, case studies and more.
I recommend using it to help you get your report watertight. Click here to find it.
Assumptions
Also, you must take into account these assumptions when reading this report:
- Availability of input items like (chicks, feed etc.)
- Proximity of the farm location to a viable marketplace
- Demand for broiler meat
- Trade stability (import and export balance)
- Availability of feed
Indian Government Subsidies For Poultry Farming Projects
Subsidised funding for such projects is offered by the government in the form of a Poultry Venture Capital Fund (PVCF-EDEG).
The goal of the Government in offering such subsidies is 3-fold:
- Encourage agri-entreprenurial start-up
- Increase production of existing operations
- Diversify the breeds and types of poultry raised commercially
Who can apply?
- Farmers
- Entrepreneurs
- Non-Governmental Organisations
- Social Enterprises…and more
How they work
Subsidy eligibility is typically broken down by region.
With priority funding allocation given to hard to reach communities like Ladakh and Kargil, for example.
All subsidies are paid back-ended.
In other words, are paid as a lump sum once you’ve cleared all loan repayments. This way your credit is discounted.
To qualify, you need to have been approved for a bank loan, with a certain degree of self-equity (margin money) invested.
How much you get
Subsidy monies are calculated and allocated as percentages of the overall project investment requirement.
Depending on the type of scheme, like APL or BPL for example,
You could expect to receive between 25% – 50% of your project requirement.
How much you need to fund
The margin money you need is 10%. The rest will be supplied by loan monies.
What you can spend the money on
There are 24 qualifying components for which you could be awarded subsidy money, including:
- type of poultry enterprise (e.g. breeding farm for low input technology bird, or hybrid broiler unit)
- refrigerated transport vehicle
- processing units
Learn more about poultry farm loans and subsidies here.
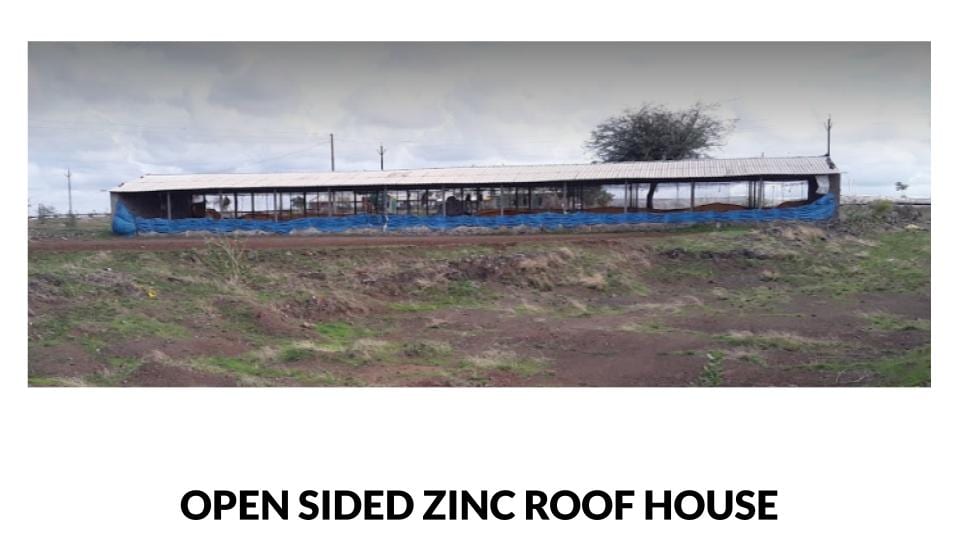
A quick note on broiler housing
I based this project on deep litter, open-sided, brick broiler houses built on concrete foundations.
Something similar to this one, in Maharashtra State – India Poultry Farm No.1:
You can find more on alternative poultry house styles here.
Economics of broiler farming to with a production capacity of 10,000 birds (using 4+1 rearing model)
The following tables contain the data of this broiler farm project report (made using Poultry Project Reporter):
TOTAL PROJECT COST
A summing up of the total amount of funds your project will need to start:
| One-Off Capital | |
| Poultry House Construction | |
| 3,500,000 | |
| Civil Building Construction | |
| 60,000 | |
| Other Construction | |
| 400,000 | |
| Feeders | |
| 105,000 | |
| Drinkers | |
| 105,000 | |
| Cages | |
| 0 | |
| Vehicles | |
| 0 | |
| Equipment | |
| 140,000 | |
| Utility Installations | |
| 90,000 | |
| TOTAL: One-off Capital Cost | |
| 4,400,000 | |
| Working Capital | |
| Chicks | |
| 2,940,000 | |
| Feed | |
| 11,840,850 | |
| Labour | |
| 522,000 | |
| Livestock Insurance | |
| 91,350 | |
| Vet Fees | |
| 91,350 | |
| Bird Processing Fees | |
| 0 | |
| TOTAL: Expenses | |
| 15,485,550 | |
| Overheads | |
| Electricity | |
| 145,000 | |
| Maintenance & Repairs | |
| 50,000 | |
| Administrative Labour | |
| 9,600 | |
| Marketing | |
| 30,000 | |
| Contingency | |
| 18,500 | |
| TOTAL: Overhead Cost | |
| 253,100 | |
| TOTAL: Working Capital Cost | |
| 15,738,650 | |
| Funding | |
| Total Project Cost | |
| 20,138,650 | |
| Margin Money | |
| 3,020,797.5 (15%) | |
| Bank Loan | |
| 17,117,852.5 | |
BROILER FEED COST
This is the cost of feeding your 4 simultaneously reared broiler flocks of 2,500 birds (each) using the 4+1 rearing system:
| Feed Price | |
| Feed Cost per KG | |
| 23 | |
| Rest Period | |
| 2 Weeks | |
| Flock Feed Consumption (KG) | |
| TOTAL: Feed Consumed by Flock (Year 1) | |
| 422,887.5 | |
| TOTAL: Feed Consumed by Flock (Year 2) | |
| 456,356.25 | |
| TOTAL: Feed Consumed by Flock (Year 3) | |
| 456,172.5 | |
| TOTAL: Feed Consumed by Flock (Year 4) | |
| 456,487.5 | |
| TOTAL: Feed Consumed by Flock (Year 5) | |
| 456,172.5 | |
| TOTAL: Feed Consumed by Flock (Year 6) | |
| 456,356.25 | |
| Flock Feed Cost | |
| TOTAL: Flock Feed Cost (Year 1) | |
| 9,726,412.5 | |
| TOTAL: Flock Feed Cost (Year 2) | |
| 10,496,193.75 | |
| TOTAL: Flock Feed Cost (Year 3) | |
| 10,491,967.5 | |
| TOTAL: Flock Feed Cost (Year 4) | |
| 10,499,212.5 | |
| TOTAL: Flock Feed Cost (Year 5) | |
| 10,491,967.5 | |
| TOTAL: Flock Feed Cost (Year 6) | |
| 10,496,193.75 | |
| Currency Symbol (Abbreviated) | |
| Rs. | |
POULTRY FARM LOAN REPAYMENT SCHEDULE
This is the monthly schedule for repaying the principal sum of Rs. 17,117,852.50 + interest over a course of 72 months (6 years):
| Loan Metrics | |
| Principal | |
| 17,117,852.5 | |
| Interest Rate | |
| 12 | |
| Effective Interest Rate | |
| 0.01 | |
| Term (Years) | |
| 6 | |
| Term (Months Converted) | |
| 72 | |
| Instalment | |
| 334,657.31 | |
| Interest 1 | |
| 171,178.53 | |
| Principal 1 | |
| 163,478.785 | |
| Balance 1 | |
| 16,954,373.72 | |
| Interest 2 | |
| 169,543.74 | |
| Principal 2 | |
| 165,113.57 | |
| Balance 2 | |
| 16,789,260.14 | |
| Interest 3 | |
| 167,892.6 | |
| Principal 3 | |
| 166,764.71 | |
| Balance 3 | |
| 16,622,495.43 | |
| Interest 4 | |
| 166,224.95 | |
| Principal 4 | |
| 168,432.36 | |
| Balance 4 | |
| 16,454,063.08 | |
| Interest 5 | |
| 164,540.63 | |
| Principal 5 | |
| 170,116.68 | |
| Balance 5 | |
| 16,283,946.4 | |
| Interest 6 | |
| 162,839.46 | |
| Principal 6 | |
| 171,817.85 | |
| Balance 6 | |
| 16,112,128.55 | |
| Interest 7 | |
| 161,121.29 | |
| Principal 7 | |
| 173,536.02 | |
| Balance 7 | |
| 15,938,592.53 | |
| Interest 8 | |
| 159,385.93 | |
| Principal 8 | |
| 175,271.38 | |
| Balance 8 | |
| 15,763,321.14 | |
| Interest 9 | |
| 157,633.21 | |
| Principal 9 | |
| 177,024.1 | |
| Balance 9 | |
| 15,586,297.04 | |
| Interest 10 | |
| 155,862.97 | |
| Principal 10 | |
| 178,794.34 | |
| Balance 10 | |
| 15,407,502.71 | |
| Interest 11 | |
| 154,075.03 | |
| Principal 11 | |
| 180,582.28 | |
| Balance 11 | |
| 15,226,920.42 | |
| Interest 12 | |
| 152,269.2 | |
| Principal 12 | |
| 182,388.11 | |
| Balance 12 | |
| 15,044,532.32 | |
| Year 1 Only – Interest | |
| 1,942,567.54 | |
| Year 1 – Cumulative Interest | |
| 1,942,567.54 | |
| Interest 13 | |
| 150,445.32 | |
| Principal 13 | |
| 184,211.99 | |
| Balance 13 | |
| 14,860,320.33 | |
| Interest 14 | |
| 148,603.2 | |
| Principal 14 | |
| 186,054.11 | |
| Balance 14 | |
| 14,674,266.22 | |
| Interest 15 | |
| 146,742.66 | |
| Principal 15 | |
| 187,914.65 | |
| Balance 15 | |
| 14,486,351.58 | |
| Interest 16 | |
| 144,863.52 | |
| Principal 16 | |
| 189,793.79 | |
| Balance 16 | |
| 14,296,557.78 | |
| Interest 17 | |
| 142,965.58 | |
| Principal 17 | |
| 191,691.73 | |
| Balance 17 | |
| 14,104,866.05 | |
| Interest 18 | |
| 141,048.66 | |
| Principal 18 | |
| 193,608.65 | |
| Balance 18 | |
| 13,911,257.4 | |
| Interest 19 | |
| 139,112.57 | |
| Principal 19 | |
| 195,544.74 | |
| Balance 19 | |
| 13,715,712.66 | |
| Interest 20 | |
| 137,157.13 | |
| Principal 20 | |
| 197,500.18 | |
| Balance 20 | |
| 13,518,212.48 | |
| Interest 21 | |
| 135,182.12 | |
| Principal 21 | |
| 199,475.19 | |
| Balance 21 | |
| 13,318,737.29 | |
| Interest 22 | |
| 133,187.37 | |
| Principal 22 | |
| 201,469.94 | |
| Balance 22 | |
| 12,913,782.72 | |
| Interest 23 | |
| 129,137.83 | |
| Principal 23 | |
| 205,519.48 | |
| Balance 23 | |
| 12,913,782.72 | |
| Interest 24 | |
| 129,137.83 | |
| Principal 24 | |
| 205,519.48 | |
| Balance 24 | |
| 12,708,263.24 | |
| Year 2 Only – Interest | |
| 1,677,583.79 | |
| Year 2 – Cumulative Interest | |
| 3,620,151.33 | |
| Interest 25 | |
| 127,082.63 | |
| Principal 25 | |
| 207,574.68 | |
| Balance 25 | |
| 12,500,688.56 | |
| Interest 26 | |
| 125,006.89 | |
| Principal 26 | |
| 209,650.42 | |
| Balance 26 | |
| 12,291,038.14 | |
| Interest 27 | |
| 122,910.38 | |
| Principal 27 | |
| 211,746.93 | |
| Balance 27 | |
| 12,079,291.21 | |
| Interest 28 | |
| 120,792.91 | |
| Principal 28 | |
| 213,864.4 | |
| Balance 28 | |
| 11,865,426.81 | |
| Interest 29 | |
| 118,654.27 | |
| Principal 29 | |
| 216,003.04 | |
| Balance 29 | |
| 11,649,423.77 | |
| Interest 30 | |
| 116,494.24 | |
| Principal 30 | |
| 218,163.07 | |
| Balance 30 | |
| 11,431,260.7 | |
| Interest 31 | |
| 114,312.61 | |
| Principal 31 | |
| 220,344.7 | |
| Balance 31 | |
| 11,210,915.99 | |
| Interest 32 | |
| 112,109.16 | |
| Principal 32 | |
| 222,548.15 | |
| Balance 32 | |
| 10,988,367.84 | |
| Interest 33 | |
| 109,883.68 | |
| Principal 33 | |
| 224,773.63 | |
| Balance 33 | |
| 10,763,594.21 | |
| Interest 34 | |
| 107,635.94 | |
| Principal 34 | |
| 227,021.37 | |
| Balance 34 | |
| 10,536,572.84 | |
| Interest 35 | |
| 105,365.73 | |
| Principal 35 | |
| 229,291.58 | |
| Balance 35 | |
| 10,307,281.26 | |
| Interest 36 | |
| 103,072.81 | |
| Principal 36 | |
| 231,584.5 | |
| Balance 36 | |
| 10,075,696.76 | |
| Year 3 Only – Interest | |
| 1,383,321.25 | |
| Year 3 – Cumulative Interest | |
| 5,003,472.58 | |
| Interest 37 | |
| 100,756.97 | |
| Principal 37 | |
| 233,900.34 | |
| Balance 37 | |
| 9,841,796.42 | |
| Interest 38 | |
| 98,417.96 | |
| Principal 38 | |
| 236,239.35 | |
| Balance 38 | |
| 9,605,557.08 | |
| Interest 39 | |
| 96,055.57 | |
| Principal 39 | |
| 238,601.74 | |
| Balance 39 | |
| 9,366,955.34 | |
| Interest 40 | |
| 93,669.55 | |
| Principal 40 | |
| 240,987.76 | |
| Balance 40 | |
| 9,125,967.58 | |
| Interest 41 | |
| 91,259.68 | |
| Principal 41 | |
| 243,397.63 | |
| Balance 41 | |
| 8,882,569.95 | |
| Interest 42 | |
| 88,825.7 | |
| Principal 42 | |
| 245,831.61 | |
| Balance 42 | |
| 8,636,738.34 | |
| Interest 43 | |
| 86,367.38 | |
| Principal 43 | |
| 248,289.93 | |
| Balance 43 | |
| 8,388,448.41 | |
| Interest 44 | |
| 83,884.48 | |
| Principal 44 | |
| 250,772.83 | |
| Balance 44 | |
| 8,137,675.58 | |
| Interest 45 | |
| 81,376.76 | |
| Principal 45 | |
| 253,280.55 | |
| Balance 45 | |
| 7,884,395.03 | |
| Interest 46 | |
| 78,843.95 | |
| Principal 46 | |
| 255,813.36 | |
| Balance 46 | |
| 7,628,581.67 | |
| Interest 47 | |
| 76,285.82 | |
| Principal 47 | |
| 258,371.49 | |
| Balance 47 | |
| 7,370,210.18 | |
| Interest 48 | |
| 73,702.1 | |
| Principal 48 | |
| 260,955.21 | |
| Balance 48 | |
| 7,109,254.97 | |
| Year 4 Only – Interest | |
| 1,049,445.92 | |
| Year 4 – Cumulative Interest | |
| 6,052,918.5 | |
| Interest 49 | |
| 71,092.55 | |
| Principal 49 | |
| 263,564.76 | |
| Balance 49 | |
| 6,845,690.21 | |
| Interest 50 | |
| 68,456.9 | |
| Principal 50 | |
| 266,200.41 | |
| Balance 50 | |
| 6,579,489.8 | |
| Interest 51 | |
| 65,794.9 | |
| Principal 51 | |
| 268,862.41 | |
| Balance 51 | |
| 6,310,627.39 | |
| Interest 52 | |
| 63,106.27 | |
| Principal 52 | |
| 271,551.04 | |
| Balance 52 | |
| 6,039,076.35 | |
| Interest 53 | |
| 60,390.76 | |
| Principal 53 | |
| 274,266.55 | |
| Balance 53 | |
| 5,764,809.8 | |
| Interest 54 | |
| 57,648.1 | |
| Principal 54 | |
| 277,009.21 | |
| Balance 54 | |
| 5,487,800.59 | |
| Interest 55 | |
| 54,878.01 | |
| Principal 55 | |
| 279,779.3 | |
| Balance 55 | |
| 5,208,021.29 | |
| Interest 56 | |
| 52,080.21 | |
| Principal 56 | |
| 282,577.1 | |
| Balance 56 | |
| 4,925,444.19 | |
| Interest 57 | |
| 49,254.44 | |
| Principal 57 | |
| 285,402.87 | |
| Balance 57 | |
| 4,640,041.32 | |
| Interest 58 | |
| 46,400.41 | |
| Principal 58 | |
| 288,256.9 | |
| Balance 58 | |
| 4,351,784.43 | |
| Interest 59 | |
| 43,517.84 | |
| Principal 59 | |
| 291,139.47 | |
| Balance 59 | |
| 4,060,644.96 | |
| Interest 60 | |
| 40,606.45 | |
| Principal 60 | |
| 294,050.86 | |
| Balance 60 | |
| 3,766,594.1 | |
| Year 5 Only – Interest | |
| 673,226.84 | |
| Year 5 – Cumulative Interest | |
| 6,726,145.34 | |
| Interest 61 | |
| 37,665.94 | |
| Principal 61 | |
| 296,991.37 | |
| Balance 61 | |
| 3,469,602.73 | |
| Interest 62 | |
| 34,696.03 | |
| Principal 62 | |
| 299,961.28 | |
| Balance 62 | |
| 3,169,641.45 | |
| Interest 63 | |
| 31,696.41 | |
| Principal 63 | |
| 302,960.9 | |
| Balance 63 | |
| 2,866,680.55 | |
| Interest 64 | |
| 28,666.81 | |
| Principal 64 | |
| 305,990.5 | |
| Balance 64 | |
| 2,560,690.05 | |
| Interest 65 | |
| 25,606.9 | |
| Principal 65 | |
| 309,050.41 | |
| Balance 65 | |
| 2,251,639.64 | |
| Interest 66 | |
| 22,516.4 | |
| Principal 66 | |
| 312,140.91 | |
| Balance 66 | |
| 1,939,498.73 | |
| Interest 67 | |
| 19,394.99 | |
| Principal 67 | |
| 315,262.32 | |
| Balance 67 | |
| 1,624,236.4 | |
| Interest 68 | |
| 16,242.36 | |
| Principal 68 | |
| 318,414.95 | |
| Balance 68 | |
| 1,305,821.46 | |
| Interest 69 | |
| 13,058.21 | |
| Principal 69 | |
| 321,599.1 | |
| Balance 69 | |
| 984,222.36 | |
| Interest 70 | |
| 9,842.22 | |
| Principal 70 | |
| 324,815.09 | |
| Balance 70 | |
| 659,407.28 | |
| Interest 71 | |
| 6,594.07 | |
| Principal 71 | |
| 328,063.24 | |
| Balance 71 | |
| 331,344.04 | |
| Interest 72 | |
| 3,313.44 | |
| Principal 72 | |
| 331,343.87 | |
| Balance 72 | |
| 0.17 | |
| Year 6 Only – Interest | |
| 249,293.78 | |
| Year 6 – Cumulative Interest | |
| 6,975,439.12 | |
| Currency Symbol (Abbreviated) | |
| Rs. | |
BROILER PRODUCTION
This is the production estimation for the no. of broiler birds successfully raised and sold at market according to the planned intervals of 4+1 rearing system:
| Rearing System & Frequency of Broiler Sales | |
| (Multiple 4+1) Fortnightly (Once Every 2 Weeks) | |
| Batch Size of Broiler Birds | |
| 2,500 | |
| Expected Bird Mortality Per Batch | |
| 125 | |
| Key Broiler Production Inputs | |
| Cost per Broiler Chick | |
| 35 | |
| Broiler Meat Price per KG | |
| 75 | |
| Average Marketable Broiler Weight (kg) | |
| 2.952 | |
| Rest Period | |
| 2 Weeks | |
| Broiler Chicks Cost | |
| TOTAL: Broiler Chick Cost (Year 1) | |
| 2,940,000 | |
| TOTAL: Broiler Chick Cost (Year 2) | |
| 2,940,000 | |
| TOTAL: Broiler Chick Cost (Year 3) | |
| 3,031,875 | |
| TOTAL: Broiler Chick Cost (Year 4) | |
| 2,940,000 | |
| TOTAL: Broiler Chick Cost (Year 5) | |
| 3,031,875 | |
| TOTAL: Broiler Chick Cost (Year 6) | |
| 2,940,000 | |
| Broiler Production | |
| TOTAL: Broiler Birds Produced (Year 1) | |
| 76,125 | |
| TOTAL: Broiler Birds Produced (Year 2) | |
| 86,625 | |
| TOTAL: Broiler Birds Produced (Year 3) | |
| 84,000 | |
| TOTAL: Broiler Birds Produced (Year 4) | |
| 86,625 | |
| TOTAL: Broiler Birds Produced (Year 5) | |
| 84,000 | |
| TOTAL: Broiler Birds Produced (Year 6) | |
| 86,625 | |
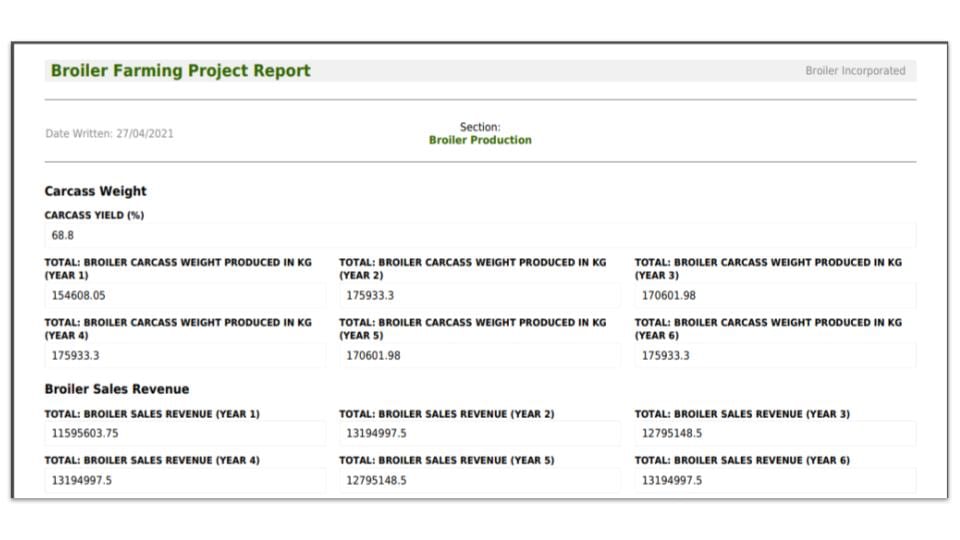
| Carcass Weight | |
| Carcass Yield (%) | |
| 68.8 | |
| TOTAL: Broiler Carcass Weight Produced in KG (Year 1) | |
| 154,608.05 | |
| TOTAL: Broiler Carcass Weight Produced in KG (Year 2) | |
| 175,933.3 | |
| TOTAL: Broiler Carcass Weight Produced in KG (Year 3) | |
| 170,601.98 | |
| TOTAL: Broiler Carcass Weight Produced in KG (Year 4) | |
| 175,933.3 | |
| TOTAL: Broiler Carcass Weight Produced in KG (Year 5) | |
| 170,601.98 | |
| TOTAL: Broiler Carcass Weight Produced in KG (Year 6) | |
| 175,933.3 | |
| Broiler Sales Revenue | |
| TOTAL: Broiler Sales Revenue (Year 1) | |
| 11,595,603.75 | |
| TOTAL: Broiler Sales Revenue (Year 2) | |
| 13,194,997.5 | |
| TOTAL: Broiler Sales Revenue (Year 3) | |
| 12,795,148.5 | |
| TOTAL: Broiler Sales Revenue (Year 4) | |
| 13,194,997.5 | |
| TOTAL: Broiler Sales Revenue (Year 5) | |
| 12,795,148.5 | |
| TOTAL: Broiler Sales Revenue (Year 6) | |
| 13,194,997.5 | |
| Currency Symbol (Abbreviated) | |
| Rs. | |
BROILER MANURE PRODUCTION
This is a running estimate of the manure produced and revenues made from rearing the broiler flocks on this farm:
| Price of Manure | |
| Manure Price per KG | |
| 3 | |
| Feed Consumption Comparative Baseline | |
| Rest Period | |
| 2 Weeks | |
| Feed vs. Manure Conversion Rate | |
| Manure to Feed Conversion Rate | |
| 0.7628458 | |
| Flock Manure Production | |
| TOTAL: Manure by Flock (Year 1) | |
| 322,597.95 | |
| TOTAL: Manure Produced by Flock (Year 2) | |
| 348,129.45 | |
| TOTAL: Manure Produced by Flock (Year 3) | |
| 347,989.28 | |
| TOTAL: Manure Produced by Flock (Year 4) | |
| 348,129.45 | |
| TOTAL: Manure Produced by Flock (Year 5) | |
| 347,989.28 | |
| TOTAL: Manure Produced by Flock (Year 6) | |
| 348,129.45 | |
| Manure Sales Revenue | |
| TOTAL: Manure Sales Revenue (Year 1) | |
| 967,793.85 | |
| TOTAL: Manure Sales Revenue (Year 2) | |
| 1,044,388.35 | |
| TOTAL: Manure Sales Revenue (Year 3) | |
| 1,043,967.84 | |
| TOTAL: Manure Sales Revenue (Year 4) | |
| 1,044,388.35 | |
| TOTAL: Manure Sales Revenue (Year 5) | |
| 1,043,967.84 | |
| TOTAL: Manure Sales Revenue (Year 6) | |
| 1,044,388.35 | |
| Currency Symbol (Abbreviated) | |
| Rs. | |
GUNNY BAG RESALE REVENUE
By reselling your used poultry feed gunny sacks there is potential supplementary income to be made in your broiler farm (this data, of course, is linked to your broiler feed consumption):
| Gunny Bag Price Metrics | |
| Size of Gunny Bag | |
| 50 KGS | |
| Resale Price per Gunny Bag | |
| 21 | |
| Flock Feed Consumption | |
| TOTAL: Feed Consumed by Flock (Year 1) | |
| 422,887.5 | |
| TOTAL: Feed Consumed by Flock (Year 2) | |
| 456,356.25 | |
| TOTAL: Feed Consumed by Flock (Year 3) | |
| 456,172.5 | |
| TOTAL: Feed Consumed by Flock (Year 4) | |
| 456,356.25 | |
| TOTAL: Feed Consumed by Flock (Year 5) | |
| 456,172.5 | |
| TOTAL: Feed Consumed by Flock (Year 6) | |
| 456,356.25 | |
| No. of Gunny Bags | |
| TOTAL: Gunny Bags Received (Year 1) | |
| 8,458 | |
| TOTAL: Gunny Bags Received (Year 2) | |
| 9,127 | |
| TOTAL: Gunny Bags Received (Year 3) | |
| 9,123 | |
| TOTAL: Gunny Bags Received (Year 4) | |
| 9,127 | |
| TOTAL: Gunny Bags Received (Year 5) | |
| 9,123 | |
| TOTAL: Gunny Bags Received (Year 6) | |
| 9,127 | |
| Gunny Bag Resale Income | |
| TOTAL: Gunny Bag Resale Income (Year 1) | |
| 177,618 | |
| TOTAL: Gunny Bag Resale Income (Year 2) | |
| 191,667 | |
| TOTAL: Gunny Bag Resale Income (Year 3) | |
| 191,583 | |
| TOTAL: Gunny Bag Resale Income (Year 4) | |
| 191,667 | |
| TOTAL: Gunny Bag Resale Income (Year 5) | |
| 191,583 | |
| TOTAL: Gunny Bag Resale Income (Year 6) | |
| 191,667 | |
| Currency Symbol (Abbreviated) | |
| Rs. | |
BROILER FARM SALES REVENUE
A combined statement of all your estimated farm sales revenue made:
| Broiler Production | |
| Year 1 – Broiler Meat Income | |
| 12,368,644 | |
| Year 2 – Broiler Meat Income | |
| 14,074,664 | |
| Year 3 – Broiler Meat Income | |
| 13,648,158.4 | |
| Year 4 – Broiler Meat Income | |
| 14,074,664 | |
| Year 5 – Broiler Meat Income | |
| 13,648,158.4 | |
| Year 6 – Broiler Meat Income | |
| 14,074,664 | |
| Manure Production | |
| Year 1 – Manure Sales Income | |
| 967,793.85 | |
| Year 2 – Manure Sales Income | |
| 1,044,388.35 | |
| Year 3 – Manure Sales Income | |
| 1,043,967.84 | |
| Year 4 – Manure Sales Income | |
| 1,044,388.35 | |
| Year 5 – Manure Sales Income | |
| 1,043,967.84 | |
| Year 6 – Manure Sales Income | |
| 1,044,388.35 | |
| By-Products | |
| Year 1 – By-Product Sales Income | |
| 0 | |
| Year 2 – By-Product Sales Income | |
| 0 | |
| Year 3 – By-Product Sales Income | |
| 0 | |
| Year 4 – By-Product Sales Income | |
| 0 | |
| Year 5 – By-Product Sales Income | |
| 0 | |
| Year 6 – By-Product Sales Income | |
| 0 | |
| Re-Sale Gunny Bags | |
| Year 1 – Gunny Bag Resale Income | |
| 177,618 | |
| Year 2 – Gunny Bag Resale Income | |
| 191,667 | |
| Year 3 – Gunny Bag Resale Income | |
| 191,583 | |
| Year 4 – Gunny Bag Resale Income | |
| 191,667 | |
| Year 5 – Gunny Bag Resale Income | |
| 191,583 | |
| Year 6 – Gunny Bag Resale Income | |
| 191,667 | |
| Project Income | |
| TOTAL: Year 1 – Income | |
| 13,514,055.85 | |
| TOTAL: Year 2 – Income | |
| 15,310,719.35 | |
| TOTAL: Year 3 – Income | |
| 14,883,709.24 | |
| TOTAL: Year 4 – Income | |
| 15,310,719.35 | |
| TOTAL: Year 5 – Income | |
| 14,883,709.24 | |
| TOTAL: Year 6 – Income | |
| 15,310,719.35 | |
| Gross Project Benefit | |
| TOTAL: Gross Benefit | |
| 89,213,632.38 | |
| Currency Symbol (Abbreviated) | |
| Rs. | |
DISCOUNTED CASH FLOW
Future forecasted cash flows for this broiler farm project, discounted by the comparative interest rate (which is a combination of India’s official inflation rate for 2020 and ICICI Bank offers Floating Rate Savings Bonds 2020):
| Comparative Interest | |
| Comparative Rate of Interest | |
| 12.1 | |
| Discounted Cash Flows | |
| Discounted Cash Flow (Year 1) | |
| -5,381,571.98 | |
| Discounted Cash Flow (Year 2) | |
| -532,897.37 | |
| Discounted Cash Flow (Year 3) | |
| -605,263.93 | |
| Discounted Cash Flow (Year 4) | |
| -28,206.1 | |
| Discounted Cash Flow (Year 5) | |
| -80,519.56 | |
| Discounted Cash Flow (Year 6) | |
| 388,642.11 | |
| Net Present Value | |
| Net Present Value of Future Cash Flows (NPV) | |
| -6,239,816.83 | |
BENEFIT-COST RATIO
Ratio analysis of how much income vs. cost your overall project is scheduled to make:
| Benefit-Cost Analysis | |
| Benefit-Cost Ratio (B/C) | |
| 0.93 | |
| Currency Symbol (Abbreviated) | |
| Rs. | |
But why a negative net present value? That isn’t good, is it?
Well, whether good or bad – it is honest.
(I’m never upset by the ROI outcome of an attempt at writing a project report. It’s there to tell me how to do things better.)
This particular set of conditions for this broiler farm using the 4+1 rearing method produce:
- negative cash flow
- a benefit-cost ratio below 1 i.e. loss making
Nil ROI.
Compared with other broiler farm project reports out there (which use All-In-All-Out or ‘AIAO’ rearing) this one seems unattractive.
But why?
(Good question.)
Looking at the detail, it’s using comparative price inputs and cost estiamtes.
So nothing revealing there…
Plus, it assumes land ownership already, just like most other project reports online that use AIAO rearing.
And so we look to the choice of rearing model…and there it is.
4+1 vs. AIAO broiler rearing model comparison
The 4+1 rearing system for broiler farming uses 5 birdhouses, not 1.
4+1 = better cash flow
The idea is that by rearing simultaneous flocks, you multiply your cash flows and smooth out business income.
In fact,
By adopting this model,
You can expect to go to market with a mature flock every 2 weeks (rather than every 6 weeks, as with AIAO method).
This adds great business advantage fueled by more consistent cash flow.
4+1 requires more capital
However,
The benefit of increased cash flow comes at the cost of having to build 5 houses…
(albeit hosting the same number of birds on your farm at any time e.g. 10,000 or 4x 2,500).
Although, the combined floor space of the 4+1 model buildings is the same as a 10,000 capacity birdhouse…
…there will undoubtedly be more effort and expense in building 5 separate houses.
Plus, 5 sets of feed wiring and storage containers etc.
There’s actually quite a bit of duplication involved.
Which presents an inconvenience to bird keepers too.
4+1 = higher operational expense
With up to 33 batches of broilers being produced every year using the 4+1 rearing model (compared to 6 with All-In-All-Out),
4+1 incurs greater operational expense because of routine repetition.
Activities like:
- catch
- bird transit
- house cleaning
- processing set-up
…for example, adds more cost to the bottom line of the multi-flock model.
Is there room for improvement?
One of the real value benefits of using the Poultry Project Reporter software is its ability to fine-tune poultry farming project reports.
A bit like a master craftsman gets his wood stock approximately in shape before adding perfecting refinements,
The 1st round results of using the Reporter software is like a rough 1st pass…
…then, I perform several tweaks to my numbers and inputs and model parameters to perfectly shape and hone my desired ROI outcome.
Where are things going wrong with the ROI in this report?
The key to this 4+1 rearing model ROI failure can be seen by taking a magnifying glass to the discounted cash flow (DCF):
Broiler Farming Project – Discounted Cash Flows
Discounted Cash Flow (Year 1)
-5,381,571.98
Discounted Cash Flow (Year 2)
-532,897.37
Discounted Cash Flow (Year 3)
-605,263.93
Discounted Cash Flow (Year 4)
-28,206.1
Discounted Cash Flow (Year 5)
-80,519.56
Discounted Cash Flow (Year 6)
388,642.11
What we see is a sliding scale of highly negative cash flow figures in Year 1 gradually improve until a clear profit is made in Year 6.
What caused this?
I traced this effect back to the loan repayment schedule. (Earnings after interest payments was the only clue I needed…this is when the earnings dipped into negative values.)
Because of the hefty loan, interest repayments tail off and end completely even in year 6,
This is when we see the farm profit surprisingly bounce back and we hit positive cash flow.
The loan is particularly large compared with the All-In-All-Out version, because of:
- the additional capital expense of the houses
- plus additional operational overheads like electricity bills for rearing simulatenous flocks etc.
Suggested profit tweaks
In this case, to raise the project’s BCR from a loss-making 0.93 to a profit-making >1, I suggest:
- reducing the broiler house construction cost (perhaps using your in-house resource)
- cheaper feed cost
- cheaper chick cost
- more ‘margin money’, less loan
- government subsidy
- more meat revenue
- more manure revenue
- more gunny bag revenue
- add broiler by-product revenue
…these are almost 10 ways to notch up that 0.93 to a value above 1.
Discrepancies
One discrepancy with other reports online is meat yield. Poultry Project Reporter software that I used shoots for accuracy.
And as such, the carcass sales are adjusted for meat yield. This means the end bird weight is cut to 68.8% of the final weight for the sake of giving a realistic revenue figure.
In other words, as not to give you an inflated expectation on income – the software corrects the income figure.
Omissions
Because this project report is written as a comparison to the other staple efforts online,
In the interest of comparing apples with apples – it carries some common omissions.
(You’ll want to plug in these gaps within your project report.)
Here are some of them:
- processing costs
- transport fees
- house cleaning costs
- depreciation costs
- deep litter costs
These costs are very REAL and would massively knock any broiler farming project report that left them out.
I would have included them in my report,
But again to help you make direct comparisons with reports out there, I keep parameters consistent.
(The Reporter software I use actually includes all of these omitted categories as standard. But it is also flexible enough to leave them out if you wish.)
Now, over to you…
Are you currently working on a broiler farm project report?
Have you produced project reports before?
Have I missed something out?
I’d be interested to hear from you.
Leave me a comment below.
Good day Mr Cole,
I would like to do the courses listed in the poultry passes program. My interest is the feed mixing, sales & marketing, record keeping and accounting etc for the poultry farming. please advise how I should go about it. I am in Uganda, and plan to expand my small 2,000 broiler operation to 20,000 and this will be my full time role. I am transitioning from formal employment and would like to do meaningful poultry farming but also earn a decent return.