This is an example commercial poultry farm proposal for expanding organic, free range egg production.
(It’s downloadable as a PDF, just press the button above.)
On this page, you’ll find a custom poultry farm proposal including:
- Background
- Proposal
- Sensitivity
- Market Demand
- Marketing & Sales
- Operations
- Financial Statements
- Assumptions
- Exclusions
- Annexure
Quick note: Although this poultry farming proposal was set in South Africa, the general principles and reading value will hold up whether you are from Ethiopia or Kenya, for example…
…Or, anywhere else for that matter. (It’s all universal stuff.)
So without further ado, let’s see the proposal!
Introduction To Poultry Farm Proposal
Yippe Yolk Farm Inc. is a successful small scale egg organic laying farm in Gauteng, South Africa.
Started in 2019, the farm began with just 3,000 layer bird capacity.
And since then (some 72 weeks later) the farm has doubled its laying capacity (6,000 layers).
This was fueled by strong consumer demand for the product.
The USP of brighter, more vibrant yolks has been especially successful with restaurant chefs and food manufacturers.
Now, the executive team are confident that given the market feedback, that there is a solid case for expanding the laying capacity to 20,000 layers.
Having landed some high-profile PR coverage with notable recommendations from leading South African chefs,
Plus, rising consumer sales in the growing network of highstreet retail venues,
It is very apparent that an expansion in capacity is earnestly warranted.
This proposal is a summarised pitch for funded and financial support required to raise the necessary growth capital.
All facts figures and findings herein are researched and provide a basis for this investment proposal.
Background
Market Analysis
“The poultry and egg industry is the largest sub-sector of the South African agricultural sector.
The poultry industry represented 16.6% or R47.9bn of the total gross value of 2018 agricultural production of R288.6bn and is the largest animal production segment.”
(Source: Business Wire)
“The South African organic industry has an estimated annual value of between R70 million to R80 million with fresh produce making up the majority (70 percent) of organic food sales (De Vynck, 2005).
This represents 0.3 percent of the 29 total food market (Irwin, 2002).
This is low in comparison with the markets in Northern America, Europe and Latin America (See Table 2.1).
It is difficult to determine the local retail demand for organic food as there is no readily available time series data on retail sales.
The leading research firm, AC Nielsen does not collate data separately for organic food products.
Currently, demand is more than the supply particularly for organic milk and chicken (Mead, 2005).”
(Source: University of Pretoria)
The statistical trend of increasing demand for organic produce in South Africa supports the 1st hand customer feedback of the company.
“In their haste to catch up, the South African chefs hardly know which way to turn. One-half of the Cape is trying to follow America, Mr. Stroebel said. The other half is trying to use the fusion of the Indian and Malay that is already here.”
“The South African national dish, bobotie, captures its essence. It was said to have been brought to Europe by the Crusaders and to Africa by both the Dutch and the Malays. In South Africa, it has become a meat pie of coarsely ground lamb with plenty of curry, bay or lemon leaves and fruits, covered with a custard of milk and eggs, as homey and much loved as meatloaf is in the United States.”
(Source: New York Times)
There’s some serious growth potential for supplying organic produce in South Africa.
Especially to high-end hospitality & event catering clients.
And it seems South African chefs are only just catching on to some of the more forward-thinking global gastro-movements.
The future is more fusion and richer blends, with a focus on vibrant colours and creamier textures.
Eggs are often a common ingredient feature, especially for the toppings like in Bobotie.
The long and short of it is there plenty more upside potential in the South African organic foods market.
(SWOT)
“Garth Stroebel, the executive chef at the Mount Nelson Hotel in Cape Town, said that until recently the best ingredients were sent out of the country.
Five years ago, we had to take what was given to us — now, we are finding growers and buying from them directly.”
(Source: New York Times)
Strengths
We have strong press coverage and already some leading names in the culinary professional circles under our belt.
We are here to serve our country’s best cooking talent.
We refuse to export our produce. We are committed to exclusively serving our own market.
And our clientele knows it. We’re really trusted domestically and that’s largely (interestingly enough) an organic thing.
Our sales are growing as our professional users expand their repertoires.
The company recently expanded capacity by 100% and the decision was proven right by our sales success.
Our share of the organic egg market has directly snowballed.
Weaknesses
Whilst we’ve benefited from increased cash flow, our capital reserves were spent on our recent expansion.
This time around we seek external capital financing to acquire land, build sheds and hold operating stock.
Opportunities
The opportunity to grow matches the market expectation – as leaders in the organic egg market, our growing userbase of professional chefs & institutions are becoming dependant.
Our desire is to walk with them, step by step – responding to their needs and entrenching our specialist supply role.
We have the conversation and don’t want to disappoint.
Threats
We can see that the profile of organic food consumption in South Africa is relatively emerging, compared with other advanced economies.
Currently, domestic producers are quite a bit behind in matching demand.
But it won’t remain that way for long.
New entrants are a constant potential. We want to capitalise on our advantage and firmly establish a strategic lead in the marketplace.
Key Factors for Success
Maintaining our healthy margins is key to the success of this growth strategy.
Sustainability is a cornerstone of the business.
Whilst we are seeking financing for this venture, it’s only because we estimate that we could miss the window and be overtaken if we try to internally fund this.
We have obtained a kind of 1st mover advantage which sets us apart from our peers.
If we self-fund this move, we might concede an advantage to another runner in this market.
Speed therefore also is a key ingredient.
Key Risks
An adverse global event like a pandemic would knock our ability to convert this goal.
Also, currently, the regulatory controls surrounding organic produce in South Africa are quite relaxed.
If that were to change, we may have some additional operational and administrative criteria to meet.
Proposal
The current demand for orders of 100,000 eggs per week exceeds our current capacity by some 70,000 eggs.
The only way we can reach this goal is to expand the farm output by 250%.
With the current constraints, the only way to achieve this is to acquire more land and build.
We would need a suitable plot of land in the region of about 150,000 – 250,000 sq.ft.
A plot like this, however: https://www.gumtree.co.za/a-land-plots-for-sale/other/calling-all-developers-business-opportunists-and-small-scale-farmers/1008838104590912583360409
Would give the project even further breathing space up to 200,000 egg per week, for R3.3m.
It’s water-rich, has plenty of organic pasture and plenty of space and room for growth.
Time is ticking. We have already just bought a batch of 6,000 layers to replace a culled batch.
Therefore we have 72 weeks of production to go before our next flock replenishment.
We aim to tie in the timeframes of both the next flock replenishment and our expanded capacity launch date.
Naturally, there will be a delay of 18-20 weeks before we start seeing egg production on the new site.
But we want to see a mirror image production profile across sites.
So, effectively we’ve got 72 weeks to:
- Scout
Acquire
Prepare
Launch
…the new production site.
Our target capacity will be 10,000 layers.
Sensitivity
The company currently charges R1.88 per egg to buyers.
If prices hold, the executive team foresees a highly profitable extension of what is a very sustainable farm business.
However, there is some in-built resilience. Currently, the estimations of margin contribution per hen over the 72 week rearing period is R.329.19.
There is enough profitable headroom here that should feed costs rise, the business should still have buoyancy in profits to continue fulfilling debt repayment and further growth goals.
Market Demand
Demand is exclusively high in this niche.
There just isn’t the supply to meet it yet. And we’re far away from getting anywhere close.
It is very much supported by trend which is in our favour but also more substantially by the desire and willingness of buyers to ‘buy local’.
We are very much ahead of the curve here and should maintain the advantage on the rest of the field.
Marketing & Sales
We already have open channels of communication and transaction with buyers. And again, their demand is yet unfulfilled.
Our PR has already started a snowball effect of awareness among our target audience. User feedback of our service and products is glowing.
We are becoming firmly established in and almost synonymous with quality organic eggs in this niche.
A strong position by any estimation.
Operations
Our operations are quite lean.
On the ground, we would require more staff on the new site to fulfill keeping the flocks and managing the grounds.
But we have good training in-house and are confident of finding the talent at an affordable rate.
The centralised admin will handle all other management functions.
Economics
This is how our numbers on this new venture stack up:
[*All exceprts, tables and snippets below are produced using Poultry Project Reporter software.]
Capital Expense
Necessary capital expenses and operational or working capital:
| One-Off Capital | |
| Land | |
| 3,300,000 | |
| Poultry House Construction | |
| 100,000 | |
| Civil Building Construction | |
| 80,000 | |
| Other Construction | |
| 4,000 | |
| Feeders | |
| 40,000 | |
| Drinkers | |
| 30,000 | |
| Cages | |
| 0 | |
| Vehicles | |
| 500,000 | |
| Equipment | |
| 75,000 | |
| Utilities Installation | |
| 0 | |
| TOTAL: One-off Capital Cost | |
| 4,129,000 | |
| Working Capital | |
| Chicks | |
| 147,788.8 | |
| Feed | |
| 2,579,677.6 | |
| Labour | |
| 70,000 | |
| Transport | |
| 30,000 | |
| Livestock Insurance | |
| 6,000 | |
| Vet Fees | |
| 8,500 | |
| TOTAL: Expenses | |
| 2,841,966.4 | |
| Overheads | |
| Mortgage | |
| 200,000 | |
| Electricity | |
| 5,000 | |
| Gas | |
| 1,500 | |
| Building Insurance | |
| 5,000 | |
| Maintenance & Repairs | |
| 10,000 | |
| Administrative Labour | |
| 25,000 | |
| Municipality Tariffs | |
| 5,000 | |
| Accounting & Bookkeeping | |
| 15,000 | |
| Marketing | |
| 25,000 | |
| Office Supplies | |
| 1,000 | |
| Contingency | |
| 5,000 | |
| TOTAL: Overhead Cost | |
| 297,500 | |
| TOTAL: Working Capital Cost | |
| 3,139,466.4 | |
| Funding | |
| Total Project Cost | |
| 7,268,466.4 | |
| Bank Loan | |
| 7,268,466.4 | |
Poultry Housing & Grounds
A summary of how much land and house floor space is needed:
| Batch Metrics | |
| Batch Size of Layer Birds | |
| 10,000 | |
| Expected Bird Mortality Rate | |
| 0.4 | |
| Expected Bird Mortality Per Batch | |
| 40 | |
| Total Capacity Size of Layer Farm | |
| 30,120 | |
| Layer Housing System | |
| Brooder Housing System | |
| Deep Litter | |
| Layer Housing System | |
| Deep Litter | |
| Bird House Floor Space | |
| Your Total Recommended Brooder Floor Space (Sq. Ft.) | |
| 5,020 | |
| Your Total Recommended Layer Floor Space (Sq. Ft.) | |
| 60,240 | |
| Your Total Recommended Bird House Floor Space (Sq. Ft.) | |
| 65,260 | |
| Currency Symbol (Abbreviated) | |
| R | |
| Unique ID | |
| PPR-L00013 | |
| Author | |
| Bernard Nkosi | |
| Proposed Business Name | |
| Yellow Yolk Farm Inc. | |
| Page Title | |
| Layer Farm Houses & Grounds | |
Feed Cost
Extimated feed cost of rearing the new flock:
| Rearing System & Frequency of Layer Egg Sales | |
| 1+2 | |
| Batch Size of Layer Birds | |
| 10,000 | |
| Expected Bird Mortality Per Batch | |
| 40 | |
| Feed Price | |
| Feed Cost per KG | |
| 5.8 | |
| Flock Feed Consumption | |
| TOTAL: Feed Consumed by Flock (Year 1) | |
| 444,772 | |
| TOTAL: Feed Consumed by Flock (Year 2) | |
| 921,270.4 | |
| TOTAL: Feed Consumed by Flock (Year 3) | |
| 931,712 | |
| TOTAL: Feed Consumed by Flock (Year 4) | |
| 900,387.2 | |
| TOTAL: Feed Consumed by Flock (Year 5) | |
| 894,764.8 | |
| TOTAL: Feed Consumed by Flock (Year 6) | |
| 907,616 | |
| Flock Feed Cost | |
| TOTAL: Flock Feed Cost (Year 1) | |
| 2,579,677.6 | |
| TOTAL: Flock Feed Cost (Year 2) | |
| 5,343,368.32 | |
| TOTAL: Flock Feed Cost (Year 3) | |
| 5,403,929.6 | |
| TOTAL: Flock Feed Cost (Year 4) | |
| 5,222,245.76 | |
| TOTAL: Flock Feed Cost (Year 5) | |
| 5,189,635.84 | |
| TOTAL: Flock Feed Cost (Year 6) | |
| 5,264,172.8 | |
Deep Litter Cost
The cost of laying down sawdust litter on the floor of the layer houses:
| Rearing System & Frequency of Layer Egg Sales | |
| 1+2 | |
| Flock Relocations | |
| Brooder Housing System | |
| Deep Litter | |
| Layer Housing System | |
| Deep Litter | |
| Type of Brooder Deep Litter | |
| Litter Material | |
| Sawdust | |
| Density (g/cm3) | |
| 0.21 | |
| Brooder Floor Space Coverage | |
| Your Total Recommended Brooder Floor Space (Sq. Ft.) | |
| 5,020 | |
| Floor Space (cm2) | |
| 4,663,730.6 | |
| Deep Litter Price | |
| Price of Material per Ton | |
| 800 | |
| Depth of Deep Litter Material for Brooder House | |
| Depth of Litter (inches) | |
| 4 | |
| Depth of Litter (cm) | |
| 10.16 | |
| Volume of Deep Litter Material to Cover Brooder House Floor | |
| Volume of Litter Required for Floor Coverage (cm3) | |
| 47,383,502.9 | |
| Weight of Brooder House Deep Litter Material | |
| Weight of Litter Required for Floor Coverage (g) | |
| 9,950,535.61 | |
| Weight of Litter Required for Floor Coverage (tons) | |
| 9.79 | |
| Cost of Brooder House Deep Litter Material | |
| Cost of Litter Required for Floor Coverage | |
| 7,832 | |
| Brooder Litter Changes | |
| Litter Changes (Year 1) | |
| 1 | |
| Litter Changes (Year 2) | |
| 2 | |
| Litter Changes (Year 3) | |
| 2 | |
| Litter Changes (Year 4) | |
| 2 | |
| Litter Changes (Year 5) | |
| 2 | |
| Litter Changes (Year 6) | |
| 2 | |
| Type of Layer Deep Litter | |
| Litter Material | |
| Sawdust | |
| Density (g/cm3) | |
| 0.21 | |
| Layer Floor Space Coverage | |
| Your Total Recommended Layer Floor Space (Sq. Ft.) | |
| 60,240 | |
| Floor Space (cm2) | |
| 55,964,767.2 | |
| Deep Litter Price | |
| Price of Material per Ton | |
| 800 | |
| Depth of Deep Litter Material for Layer Houses | |
| Depth of Litter (inches) | |
| 4 | |
| Depth of Litter (cm) | |
| 10.16 | |
| Volume of Deep Litter Material to Cover Floor of Layer Houses | |
| Volume of Litter Required for Floor Coverage (cm3) | |
| 568,602,034.75 | |
| Weight of Layer House Deep Litter Material | |
| Weight of Litter Required for Floor Coverage (g) | |
| 119,406,427.3 | |
| Weight of Litter Required for Floor Coverage (tons) | |
| 117.52 | |
| Cost of Deep Litter Material | |
| Cost of Litter Required for Floor Coverage | |
| 94,016 | |
| Layer Litter Changes | |
| Frequency | |
| 6 Months | |
| Litter Changes (Year 1) | |
| 3 | |
| Litter Changes (Year 2) | |
| 4 | |
| Litter Changes (Year 3) | |
| 4 | |
| Litter Changes (Year 4) | |
| 4 | |
| Litter Changes (Year 5) | |
| 4 | |
| Litter Changes (Year 6) | |
| 4 | |
| Annual Deep Litter Cost | |
| TOTAL: Cost of Litter Required (Year 1) | |
| 289,880 | |
| TOTAL: Cost of Litter Required (Year 2) | |
| 391,728 | |
| TOTAL: Cost of Litter Required (Year 3) | |
| 391,728 | |
| TOTAL: Cost of Litter Required (Year 4) | |
| 391,728 | |
| TOTAL: Cost of Litter Required (Year 5) | |
| 391,728 | |
| TOTAL: Cost of Litter Required (Year 6) | |
| 391,728 | |
| Currency Symbol (Abbreviated) | |
| R | |
| Unique ID | |
| PPR-L00013 | |
| Author | |
| Bernard Nkosi | |
| Proposed Business Name | |
| Yellow Yolk Farm Inc. | |
| Page Title | |
| Layer Farm Deep Litter | |
Operating Expenses
The direct cost of running the layer farm:
| Rearing System & Frequency of Layer Egg Sales | |
| 1+2 | |
| Batch Size of Broiler Birds | |
| 10,000 | |
| Expected Bird Mortality Per Batch | |
| 40 | |
| Deep Litter Cost | |
| Deep Litter Cost (Year 1) | |
| 289,880 | |
| Deep Litter Cost (Year 2) | |
| 391,728 | |
| Deep Litter Cost (Year 3) | |
| 391,728 | |
| Deep Litter Cost (Year 4) | |
| 391,728 | |
| Deep Litter Cost (Year 5) | |
| 391,728 | |
| Deep Litter Cost (Year 6) | |
| 391,728 | |
| Bird House Cleaning Cost | |
| Bird House Cleaning Cost (Year 1) | |
| 4,720 | |
| Bird House Cleaning Cost (Year 2) | |
| 9,440 | |
| Bird House Cleaning Cost (Year 3) | |
| 9,440 | |
| Bird House Cleaning Cost (Year 4) | |
| 9,440 | |
| Bird House Cleaning Cost (Year 5) | |
| 9,440 | |
| Bird House Cleaning Cost (Year 6) | |
| 9,440 | |
| Vet Cost | |
| Vet Fees (Year 1) | |
| 6,024 | |
| Vet Fees (Year 2) | |
| 6,024 | |
| Vet Fees (Year 3) | |
| 6,024 | |
| Vet Fees (Year 4) | |
| 6,024 | |
| Vet Fees (Year 5) | |
| 6,024 | |
| Vet Fees (Year 6) | |
| 6,024 | |
| Livestock Cost | |
| Livestock Insurance Cost (Year 1) | |
| 6,024 | |
| Livestock Insurance Cost (Year 2) | |
| 6,024 | |
| Livestock Insurance Cost (Year 3) | |
| 6,024 | |
| Livestock Insurance Cost (Year 4) | |
| 6,024 | |
| Livestock Insurance Cost (Year 5) | |
| 6,024 | |
| Livestock Insurance Cost (Year 6) | |
| 6,024 | |
| Fuel Cost | |
| Fuel Cost (Year 1) | |
| 3,982.08 | |
| Fuel Cost (Year 2) | |
| 9,955.2 | |
| Fuel Cost (Year 3) | |
| 10,248.96 | |
| Fuel Cost (Year 4) | |
| 10,069.44 | |
| Fuel Cost (Year 5) | |
| 9,873.6 | |
| Fuel Cost (Year 6) | |
| 9,955.2 | |
| Labour Cost | |
| Husbandry Labour Cost (Year 1) | |
| 68,640 | |
| Husbandry Labour Cost (Year 2) | |
| 68,640 | |
| Husbandry Labour Cost (Year 3) | |
| 68,640 | |
| Husbandry Labour Cost (Year 4) | |
| 68,640 | |
| Husbandry Labour Cost (Year 5) | |
| 68,640 | |
| Husbandry Labour Cost (Year 6) | |
| 68,640 | |
| Flock Feed Cost | |
| TOTAL: Flock Feed Cost (Year 1) | |
| 2,579,677.6 | |
| TOTAL: Flock Feed Cost (Year 2) | |
| 5,343,368.32 | |
| TOTAL: Flock Feed Cost (Year 3) | |
| 5,403,929.6 | |
| TOTAL: Flock Feed Cost (Year 4) | |
| 5,222,245.76 | |
| TOTAL: Flock Feed Cost (Year 5) | |
| 5,189,635.84 | |
| TOTAL: Flock Feed Cost (Year 6) | |
| 5,264,172.8 | |
| Layer Chicks Bought | |
| TOTAL: Layer Chick Cost (Year 1) | |
| 147,788.8 | |
| TOTAL: Layer Chick Cost (Year 2) | |
| 147,788.8 | |
| TOTAL: Layer Chick Cost (Year 3) | |
| 147,788.8 | |
| TOTAL: Layer Chick Cost (Year 4) | |
| 147,788.8 | |
| TOTAL: Layer Chick Cost (Year 5) | |
| 147,788.8 | |
| TOTAL: Layer Chick Cost (Year 6) | |
| 147,788.8 | |
| Total Expenses | |
| Total Expenses (Year 1) | |
| 3,106,736.48 | |
| Total Expenses (Year 2) | |
| 5,982,968.32 | |
| Total Expenses (Year 3) | |
| 6,043,823.36 | |
| Total Expenses (Year 4) | |
| 5,861,960 | |
| Total Expenses (Year 5) | |
| 5,829,154.24 | |
| Total Expenses (Year 6) | |
| 5,903,772.8 | |
| Currency Symbol (Abbreviated) | |
| R | |
| Unique ID | |
| PPR-L00013 | |
| Page Title | |
| Layer Farm Direct Costs | |
ROI Metrics
Key facts and figures for growing this business:
| Feed Conversion | |
| TOTAL: Rearing Feed in KG | |
| 48.94 | |
| Average Weight of Egg (g) | |
| 55 | |
| Eggs Produced By 1 Bird in 72 From Birth | |
| 330 | |
| FCR (Feed Conversion Ratio) | |
| 2.6964187327824 | |
| Cost Analysis | |
| Cost per KG of Feed | |
| 5.8 | |
| Cost of Layer Chick | |
| 7.36 | |
| TOTAL: Input Cost To Rear 1 Layer to 72 Weeks | |
| 291.21 | |
| Revenue & Margin | |
| Price per Egg | |
| 1.88 | |
| Average Sales Revenue per Bird in 72 Weeks | |
| 620.4 | |
| Layer Hen Profit Contribution | |
| 329.19 | |
| Manure Yield | |
| Manure to Feed Conversion Rate | |
| 0.7628458 | |
| Manure per Bird per Rearing Cycle (KG) | |
| 37.33 | |
| Currency Symbol (Abbreviated) | |
| R | |
| Unique ID | |
| PPR-L00013 | |
| Author | |
| Bernard Nkosi | |
| Proposed Business Name | |
| Yellow Yolk Farm Inc. | |
| Page Title | |
| Layer Farm ROI Metrics | |
Combined Sales Revenue
Money made from selling eggs, spent hens, manure and gunny bags:
| Egg Production | |
| Year 1 – Egg Sales Income | |
| 4,605,548.8 | |
| Year 2 – Egg Sales Income | |
| 11,513,872 | |
| Year 3 – Egg Sales Income | |
| 11,853,625.6 | |
| Year 4 – Egg Sales Income | |
| 11,645,998.4 | |
| Year 5 – Egg Sales Income | |
| 11,419,496 | |
| Year 6 – Egg Sales Income | |
| 11,513,872 | |
| Manure Production | |
| Year 1 – Manure Sales Income | |
| 508,938.68 | |
| Year 2 – Manure Sales Income | |
| 1,054,180.89 | |
| Year 3 – Manure Sales Income | |
| 1,066,128.89 | |
| Year 4 – Manure Sales Income | |
| 1,030,284.89 | |
| Year 5 – Manure Sales Income | |
| 1,023,851.36 | |
| Year 6 – Manure Sales Income | |
| 1,038,556.58 | |
| Spent Hens | |
| Year 1 – Spent Hen Sales Income | |
| 0 | |
| Year 2 – Spent Hen Sales Income | |
| 567,059.2 | |
| Year 3 – Spent Hen Sales Income | |
| 567,059.2 | |
| Year 4 – Spent Hen Sales Income | |
| 283,529.6 | |
| Year 5 – Spent Hen Sales Income | |
| 567,059.2 | |
| Year 6 – Spent Hen Sales Income | |
| 567,059.2 | |
| Re-Sale Gunny Bags | |
| Year 1 – Gunny Bag Resale Income | |
| 259,455 | |
| Year 2 – Gunny Bag Resale Income | |
| 537,425 | |
| Year 3 – Gunny Bag Resale Income | |
| 543,515 | |
| Year 4 – Gunny Bag Resale Income | |
| 525,210 | |
| Year 5 – Gunny Bag Resale Income | |
| 521,955 | |
| Year 6 – Gunny Bag Resale Income | |
| 529,445 | |
| Project Income | |
| TOTAL: Year 1 – Income | |
| 5,373,942.48 | |
| TOTAL: Year 2 – Income | |
| 13,672,537.09 | |
| TOTAL: Year 3 – Income | |
| 14,030,328.69 | |
| TOTAL: Year 4 – Income | |
| 13,485,022.89 | |
| TOTAL: Year 5 – Income | |
| 13,532,361.56 | |
| TOTAL: Year 6 – Income | |
| 13,648,932.78 | |
| Gross Project Benefit | |
| TOTAL: Gross Benefit | |
| 73,743,125.49 | |
| Currency Symbol (Abbreviated) | |
| R | |
| Unique ID | |
| PPR-L00013 | |
| Author | |
| Bernard Nkosi | |
| Proposed Business Name | |
| Yellow Yolk Farm Inc. | |
| Page Title | |
| Layer Farm Sales Revenue | |
Gunny Bag Income
Breakdown of gunny bag sales:
| Rearing System & Frequency of Layer Egg Sales | |
| 1+2 | |
| Batch Size of Layer Birds | |
| 10,000 | |
| Expected Bird Mortality Per Batch | |
| 40 | |
| Gunny Bag Price Metrics | |
| Size of Gunny Bag | |
| 60 KGS | |
| Resale Price per Gunny Bag | |
| 35 | |
| Flock Feed Consumption | |
| TOTAL: Feed Consumed by Flock (Year 1) | |
| 444,772 | |
| TOTAL: Feed Consumed by Flock (Year 2) | |
| 921,270.4 | |
| TOTAL: Feed Consumed by Flock (Year 3) | |
| 931,712 | |
| TOTAL: Feed Consumed by Flock (Year 4) | |
| 900,387.2 | |
| TOTAL: Feed Consumed by Flock (Year 5) | |
| 894,764.8 | |
| TOTAL: Feed Consumed by Flock (Year 6) | |
| 907,616 | |
| No. of Gunny Bags | |
| TOTAL: Gunny Bags Received (Year 1) | |
| 7,413 | |
| TOTAL: Gunny Bags Received (Year 2) | |
| 15,355 | |
| TOTAL: Gunny Bags Received (Year 3) | |
| 15,529 | |
| TOTAL: Gunny Bags Received (Year 4) | |
| 15,006 | |
| TOTAL: Gunny Bags Received (Year 5) | |
| 14,913 | |
| TOTAL: Gunny Bags Received (Year 6) | |
| 15,127 | |
| Gunny Bag Resale Income | |
| TOTAL: Gunny Bag Resale Income (Year 1) | |
| 259,455 | |
| TOTAL: Gunny Bag Resale Income (Year 2) | |
| 537,425 | |
| TOTAL: Gunny Bag Resale Income (Year 3) | |
| 543,515 | |
| TOTAL: Gunny Bag Resale Income (Year 4) | |
| 525,210 | |
| TOTAL: Gunny Bag Resale Income (Year 5) | |
| 521,955 | |
| TOTAL: Gunny Bag Resale Income (Year 6) | |
| 529,445 | |
| Currency Symbol (Abbreviated) | |
| R | |
| Unique ID | |
| PPR-L00013 | |
| Author | |
| Bernard Nkosi | |
| Proposed Business Name | |
| Yellow Yolk Farm Inc. | |
| Page Title | |
| Layer Farm Gunny Bag Resale | |
Spent Hen Income
Breakdown of spent hen sales:
|
||||||||||||||||||||||||||||||||||||||||||||||||||||||||||||||||||||||||||||||||||||||||||||||
Manure Sales Income
Breakdown of manure sales:
| Rearing System & Frequency of Layer Egg Sales | |
| 1+2 | |
| Batch Size of Broiler Birds | |
| 10,000 | |
| Expected Bird Mortality Per Batch | |
| 40 | |
| Price of Manure | |
| Manure Price per KG | |
| 1.5 | |
| Feed vs. Manure Conversion Rate | |
| Manure to Feed Conversion Rate | |
| 0.7628458 | |
| Flock Manure Production | |
| TOTAL: Manure Produced by Flock (Year 1) | |
| 339,292.45 | |
| TOTAL: Manure Produced by Flock (Year 2) | |
| 702,787.26 | |
| TOTAL: Manure Produced by Flock (Year 3) | |
| 710,752.59 | |
| TOTAL: Manure Produced by Flock (Year 4) | |
| 686,856.59 | |
| TOTAL: Manure Produced by Flock (Year 5) | |
| 682,567.57 | |
| TOTAL: Manure Produced by Flock (Year 6) | |
| 692,371.05 | |
| Manure Sales Revenue | |
| TOTAL: Manure Sales Revenue (Year 1) | |
| 508,938.68 | |
| TOTAL: Manure Sales Revenue (Year 2) | |
| 1,054,180.89 | |
| TOTAL: Manure Sales Revenue (Year 3) | |
| 1,066,128.89 | |
| TOTAL: Manure Sales Revenue (Year 4) | |
| 1,030,284.89 | |
| TOTAL: Manure Sales Revenue (Year 5) | |
| 1,023,851.36 | |
| TOTAL: Manure Sales Revenue (Year 6) | |
| 1,038,556.58 | |
| Currency Symbol (Abbreviated) | |
| R | |
| Unique ID | |
| PPR-L00013 | |
| Author | |
| Bernard Nkosi | |
| Proposed Business Name | |
| Yellow Yolk Farm Inc. | |
| Page Title | |
| Layer Manure Production | |
Income Statement
Profit and loss of the poultry farm unit:
| Depreciation | |
| Annual Depreciation | |
| 30.33 | |
| Loan Interest | |
| Year 1 – Interest | |
| 310.05 | |
| Year 2 – Interest | |
| 254.36 | |
| Year 3 – Interest | |
| 199.13 | |
| Year 4 – Interest | |
| 143.28 | |
| Year 5 – Interest | |
| 87.12 | |
| Year 6 – Interest | |
| 30.67 | |
| Sales Revenues | |
| Sales Revenue (Year 1) | |
| 5,373,942.48 | |
| Sales Revenue (Year 2) | |
| 13,672,537.09 | |
| Sales Revenue (Year 3) | |
| 14,030,328.69 | |
| Sales Revenue (Year 4) | |
| 13,485,022.89 | |
| Sales Revenue (Year 5) | |
| 13,532,361.56 | |
| Sales Revenue (Year 6) | |
| 13,648,932.78 | |
| Cost of Goods Sold | |
| Direct Costs (Year 1) | |
| 3,106,736.48 | |
| Direct Costs (Year 2) | |
| 5,982,968.32 | |
| Direct Costs (Year 3) | |
| 6,043,823.36 | |
| Direct Costs (Year 4) | |
| 5,861,960 | |
| Direct Costs (Year 5) | |
| 5,829,154.24 | |
| Direct Costs (Year 6) | |
| 5,903,772.8 | |
| Gross Profit / Loss (Margin) | |
| Gross Margin (Year 1) | |
| 2,267,206 | |
| Gross Margin (Year 2) | |
| 7,689,568.77 | |
| Gross Margin (Year 3) | |
| 7,986,505.33 | |
| Gross Margin (Year 4) | |
| 7,623,062.89 | |
| Gross Margin (Year 5) | |
| 7,703,207.32 | |
| Gross Margin (Year 6) | |
| 7,745,159.98 | |
| Operating Overheads | |
| Capital Repayment of Loan – HIDDEN | |
| 931.22 | |
| Indirect Costs (Year1) – HIDDEN | |
| 109,780.16 | |
| Indirect Costs (Year 1) | |
| 110,711.38 | |
| Indirect Costs (Year 2) | |
| 110,711.38 | |
| Indirect Costs (Year 3) | |
| 110,711.38 | |
| Indirect Costs (Year 4) | |
| 110,711.38 | |
| Indirect Costs (Year 5) | |
| 110,711.38 | |
| Indirect Costs (Year 6) | |
| 110,711.38 | |
| EBITDA | |
| Earnings Before Deductions (Year 1) | |
| 2,156,494.62 | |
| Earnings Before Deductions (Year 2) | |
| 7,578,857.39 | |
| Earnings Before Deductions (Year 3) | |
| 7,875,793.95 | |
| Earnings Before Deductions (Year 4) | |
| 7,512,351.51 | |
| Earnings Before Deductions (Year 5) | |
| 7,592,495.94 | |
| Earnings Before Deductions (Year 6) | |
| 7,634,448.6 | |
| EBIT | |
| Earnings Before Interest & Tax (Year 1) | |
| 2,156,464.29 | |
| Earnings Before Interest & Tax (Year 2) | |
| 7,578,827.06 | |
| Earnings Before Interest & Tax (Year 3) | |
| 7,875,763.62 | |
| Earnings Before Interest & Tax (Year 4) | |
| 7,512,321.18 | |
| Earnings Before Interest & Tax (Year 5) | |
| 7,592,465.61 | |
| Earnings Before Interest & Tax (Year 6) | |
| 7,634,418.27 | |
| EBT | |
| Earnings Before Tax (Year 1) | |
| 2,156,154.24 | |
| Earnings Before Tax (Year 2) | |
| 7,578,572.7 | |
| Earnings Before Tax (Year 3) | |
| 7,875,564.49 | |
| Earnings Before Tax (Year 4) | |
| 7,512,177.9 | |
| Earnings Before Tax (Year 5) | |
| 7,592,378.49 | |
| Earnings Before Tax (Year 6) | |
| 7,634,387.6 | |
| Project Summary | |
| TOTAL: Running Costs | |
| 33,393,890.07 | |
| TOTAL: Revenues | |
| 73,743,125.49 | |
Discounted Cash Flow
Total discounted cash flows of the poultry farm business:
| Comparative Interest | |
| Comparative Rate of Interest | |
| 6 | |
| Discounted Cash Flows | |
| Discounted Cash Flow (Year 1) | |
| -1,861,175.25 | |
| Discounted Cash Flow (Year 2) | |
| 6,744,902.72 | |
| Discounted Cash Flow (Year 3) | |
| 6,612,475.81 | |
| Discounted Cash Flow (Year 4) | |
| 5,950,348.51 | |
| Discounted Cash Flow (Year 5) | |
| 5,673,466.88 | |
| Discounted Cash Flow (Year 6) | |
| 5,381,942.01 | |
| Net Present Value | |
| Net Present Value of Future Cash Flows (NPV) | |
| 28,501,960.68 | |
| Project Benefit & Costs | |
| (SILENT) TOTAL: Revenues | |
| 73,743,125.49 | |
| TOTAL: Revenues | |
| 73,743,125.49 | |
| Project Cost | |
| TOTAL: Running Costs | |
| 33,393,890.07 | |
| TOTAL: Running Costs + One-Off Capital Cost | |
| 37,522,890.07 | |
| Benefit Cost Analysis | |
| Benefit Cost Ratio (B/C) | |
| 1.97 | |
| Currency Symbol (Abbreviated) | |
| R | |
| Unique ID | |
| PPR-L00013 | |
| Author | |
| Bernard Nkosi | |
| Proposed Business Name | |
| Yellow Yolk Farm Inc. | |
| Page Title | |
| Layer Farm Cash Flow (DCF, IRR, NPV, BCR) | |
Loan Repayment
The scedhuuled loan repayments for financing the venture:
| Loan Metrics | |
| Principal | |
| 7,268,466.4 | |
| Interest Rate | |
| 18.5 | |
| Effective Interest Rate | |
| 0.015416666666667 | |
| Term (Years) | |
| 6 | |
| Term (Months Converted) | |
| 72 | |
| Instalment | |
| 167,838.73 | |
| Interest 1 | |
| 112,055.52 | |
| Principal 1 | |
| 55,783.206333331 | |
| Balance 1 | |
| 7,212,683.19 | |
| Interest 2 | |
| 111,195.53 | |
| Principal 2 | |
| 56,643.2 | |
| Balance 2 | |
| 7,156,040 | |
| Interest 3 | |
| 110,322.28 | |
| Principal 3 | |
| 57,516.45 | |
| Balance 3 | |
| 7,098,523.55 | |
| Interest 4 | |
| 109,435.57 | |
| Principal 4 | |
| 58,403.16 | |
| Balance 4 | |
| 7,040,120.39 | |
| Interest 5 | |
| 108,535.19 | |
| Principal 5 | |
| 59,303.54 | |
| Balance 5 | |
| 6,980,816.85 | |
| Interest 6 | |
| 107,620.93 | |
| Principal 6 | |
| 60,217.8 | |
| Balance 6 | |
| 6,920,599.05 | |
| Interest 7 | |
| 106,692.57 | |
| Principal 7 | |
| 61,146.16 | |
| Balance 7 | |
| 6,859,452.89 | |
| Interest 8 | |
| 105,749.9 | |
| Principal 8 | |
| 62,088.83 | |
| Balance 8 | |
| 6,797,364.05 | |
| Interest 9 | |
| 104,792.7 | |
| Principal 9 | |
| 63,046.03 | |
| Balance 9 | |
| 6,734,318.02 | |
| Interest 10 | |
| 103,820.74 | |
| Principal 10 | |
| 64,017.99 | |
| Balance 10 | |
| 6,670,300.03 | |
| Interest 11 | |
| 102,833.79 | |
| Principal 11 | |
| 65,004.94 | |
| Balance 11 | |
| 6,605,295.09 | |
| Interest 12 | |
| 101,831.63 | |
| Principal 12 | |
| 66,007.1 | |
| Balance 12 | |
| 6,539,287.99 | |
| Year 1 Only – Interest | |
| 1,284,886.35 | |
| Year 1 – Cumulative Interest | |
| 1,284,886.35 | |
| Interest 13 | |
| 100,814.02 | |
| Principal 13 | |
| 67,024.71 | |
| Balance 13 | |
| 6,472,263.28 | |
| Interest 14 | |
| 99,780.73 | |
| Principal 14 | |
| 68,058 | |
| Balance 14 | |
| 6,404,205.28 | |
| Interest 15 | |
| 98,731.5 | |
| Principal 15 | |
| 69,107.23 | |
| Balance 15 | |
| 6,335,098.05 | |
| Interest 16 | |
| 97,666.09 | |
| Principal 16 | |
| 70,172.64 | |
| Balance 16 | |
| 6,264,925.41 | |
| Interest 17 | |
| 96,584.27 | |
| Principal 17 | |
| 71,254.46 | |
| Balance 17 | |
| 6,193,670.95 | |
| Interest 18 | |
| 95,485.76 | |
| Principal 18 | |
| 72,352.97 | |
| Balance 18 | |
| 6,121,317.98 | |
| Interest 19 | |
| 94,370.32 | |
| Principal 19 | |
| 73,468.41 | |
| Balance 19 | |
| 6,047,849.57 | |
| Interest 20 | |
| 93,237.68 | |
| Principal 20 | |
| 74,601.05 | |
| Balance 20 | |
| 5,973,248.52 | |
| Interest 21 | |
| 92,087.58 | |
| Principal 21 | |
| 75,751.15 | |
| Balance 21 | |
| 5,897,497.37 | |
| Interest 22 | |
| 90,919.75 | |
| Principal 22 | |
| 76,918.98 | |
| Balance 22 | |
| 5,742,473.58 | |
| Interest 23 | |
| 88,529.8 | |
| Principal 23 | |
| 79,308.93 | |
| Balance 23 | |
| 5,742,473.58 | |
| Interest 24 | |
| 88,529.8 | |
| Principal 24 | |
| 79,308.93 | |
| Balance 24 | |
| 5,663,164.65 | |
| Year 2 Only – Interest | |
| 1,136,737.3 | |
| Year 2 – Cumulative Interest | |
| 2,421,623.65 | |
| Interest 25 | |
| 87,307.12 | |
| Principal 25 | |
| 80,531.61 | |
| Balance 25 | |
| 5,582,633.04 | |
| Interest 26 | |
| 86,065.59 | |
| Principal 26 | |
| 81,773.14 | |
| Balance 26 | |
| 5,500,859.9 | |
| Interest 27 | |
| 84,804.92 | |
| Principal 27 | |
| 83,033.81 | |
| Balance 27 | |
| 5,417,826.1 | |
| Interest 28 | |
| 83,524.82 | |
| Principal 28 | |
| 84,313.91 | |
| Balance 28 | |
| 5,333,512.19 | |
| Interest 29 | |
| 82,224.98 | |
| Principal 29 | |
| 85,613.75 | |
| Balance 29 | |
| 5,247,898.44 | |
| Interest 30 | |
| 80,905.1 | |
| Principal 30 | |
| 86,933.63 | |
| Balance 30 | |
| 5,160,964.81 | |
| Interest 31 | |
| 79,564.87 | |
| Principal 31 | |
| 88,273.86 | |
| Balance 31 | |
| 5,072,690.95 | |
| Interest 32 | |
| 78,203.99 | |
| Principal 32 | |
| 89,634.74 | |
| Balance 32 | |
| 4,983,056.21 | |
| Interest 33 | |
| 76,822.12 | |
| Principal 33 | |
| 91,016.61 | |
| Balance 33 | |
| 4,892,039.59 | |
| Interest 34 | |
| 75,418.94 | |
| Principal 34 | |
| 92,419.79 | |
| Balance 34 | |
| 4,799,619.81 | |
| Interest 35 | |
| 73,994.14 | |
| Principal 35 | |
| 93,844.59 | |
| Balance 35 | |
| 4,705,775.22 | |
| Interest 36 | |
| 72,547.37 | |
| Principal 36 | |
| 95,291.36 | |
| Balance 36 | |
| 4,610,483.85 | |
| Year 3 Only – Interest | |
| 961,383.96 | |
| Year 3 – Cumulative Interest | |
| 3,383,007.61 | |
| Interest 37 | |
| 71,078.29 | |
| Principal 37 | |
| 96,760.44 | |
| Balance 37 | |
| 4,513,723.42 | |
| Interest 38 | |
| 69,586.57 | |
| Principal 38 | |
| 98,252.16 | |
| Balance 38 | |
| 4,415,471.26 | |
| Interest 39 | |
| 68,071.85 | |
| Principal 39 | |
| 99,766.88 | |
| Balance 39 | |
| 4,315,704.37 | |
| Interest 40 | |
| 66,533.78 | |
| Principal 40 | |
| 101,304.95 | |
| Balance 40 | |
| 4,214,399.42 | |
| Interest 41 | |
| 64,971.99 | |
| Principal 41 | |
| 102,866.74 | |
| Balance 41 | |
| 4,111,532.68 | |
| Interest 42 | |
| 63,386.13 | |
| Principal 42 | |
| 104,452.6 | |
| Balance 42 | |
| 4,007,080.08 | |
| Interest 43 | |
| 61,775.82 | |
| Principal 43 | |
| 106,062.91 | |
| Balance 43 | |
| 3,901,017.17 | |
| Interest 44 | |
| 60,140.68 | |
| Principal 44 | |
| 107,698.05 | |
| Balance 44 | |
| 3,793,319.12 | |
| Interest 45 | |
| 58,480.34 | |
| Principal 45 | |
| 109,358.39 | |
| Balance 45 | |
| 3,683,960.73 | |
| Interest 46 | |
| 56,794.39 | |
| Principal 46 | |
| 111,044.34 | |
| Balance 46 | |
| 3,572,916.39 | |
| Interest 47 | |
| 55,082.46 | |
| Principal 47 | |
| 112,756.27 | |
| Balance 47 | |
| 3,460,160.12 | |
| Interest 48 | |
| 53,344.14 | |
| Principal 48 | |
| 114,494.59 | |
| Balance 48 | |
| 3,345,665.53 | |
| Year 4 Only – Interest | |
| 749,246.44 | |
| Year 4 – Cumulative Interest | |
| 4,132,254.05 | |
| Interest 49 | |
| 51,579.01 | |
| Principal 49 | |
| 116,259.72 | |
| Balance 49 | |
| 3,229,405.81 | |
| Interest 50 | |
| 49,786.67 | |
| Principal 50 | |
| 118,052.06 | |
| Balance 50 | |
| 3,111,353.75 | |
| Interest 51 | |
| 47,966.7 | |
| Principal 51 | |
| 119,872.03 | |
| Balance 51 | |
| 2,991,481.72 | |
| Interest 52 | |
| 46,118.68 | |
| Principal 52 | |
| 121,720.05 | |
| Balance 52 | |
| 2,869,761.67 | |
| Interest 53 | |
| 44,242.16 | |
| Principal 53 | |
| 123,596.57 | |
| Balance 53 | |
| 2,746,165.1 | |
| Interest 54 | |
| 42,336.71 | |
| Principal 54 | |
| 125,502.02 | |
| Balance 54 | |
| 2,620,663.08 | |
| Interest 55 | |
| 40,401.89 | |
| Principal 55 | |
| 127,436.84 | |
| Balance 55 | |
| 2,493,226.24 | |
| Interest 56 | |
| 38,437.24 | |
| Principal 56 | |
| 129,401.49 | |
| Balance 56 | |
| 2,363,824.75 | |
| Interest 57 | |
| 36,442.3 | |
| Principal 57 | |
| 131,396.43 | |
| Balance 57 | |
| 2,232,428.32 | |
| Interest 58 | |
| 34,416.6 | |
| Principal 58 | |
| 133,422.13 | |
| Balance 58 | |
| 2,099,006.19 | |
| Interest 59 | |
| 32,359.68 | |
| Principal 59 | |
| 135,479.05 | |
| Balance 59 | |
| 1,963,527.14 | |
| Interest 60 | |
| 30,271.04 | |
| Principal 60 | |
| 137,567.69 | |
| Balance 60 | |
| 1,825,959.45 | |
| Year 5 Only – Interest | |
| 494,358.68 | |
| Year 5 – Cumulative Interest | |
| 4,626,612.73 | |
| Interest 61 | |
| 28,150.21 | |
| Principal 61 | |
| 139,688.52 | |
| Balance 61 | |
| 1,686,270.93 | |
| Interest 62 | |
| 25,996.68 | |
| Principal 62 | |
| 141,842.05 | |
| Balance 62 | |
| 1,544,428.88 | |
| Interest 63 | |
| 23,809.95 | |
| Principal 63 | |
| 144,028.78 | |
| Balance 63 | |
| 1,400,400.09 | |
| Interest 64 | |
| 21,589.5 | |
| Principal 64 | |
| 146,249.23 | |
| Balance 64 | |
| 1,254,150.86 | |
| Interest 65 | |
| 19,334.83 | |
| Principal 65 | |
| 148,503.9 | |
| Balance 65 | |
| 1,105,646.96 | |
| Interest 66 | |
| 17,045.39 | |
| Principal 66 | |
| 150,793.34 | |
| Balance 66 | |
| 954,853.62 | |
| Interest 67 | |
| 14,720.66 | |
| Principal 67 | |
| 153,118.07 | |
| Balance 67 | |
| 801,735.55 | |
| Interest 68 | |
| 12,360.09 | |
| Principal 68 | |
| 155,478.64 | |
| Balance 68 | |
| 646,256.91 | |
| Interest 69 | |
| 9,963.13 | |
| Principal 69 | |
| 157,875.6 | |
| Balance 69 | |
| 488,381.31 | |
| Interest 70 | |
| 7,529.21 | |
| Principal 70 | |
| 160,309.52 | |
| Balance 70 | |
| 328,071.79 | |
| Interest 71 | |
| 5,057.77 | |
| Principal 71 | |
| 162,780.96 | |
| Balance 71 | |
| 165,290.83 | |
| Interest 72 | |
| 2,548.23 | |
| Principal 72 | |
| 165,290.5 | |
| Balance 72 | |
| 0.33 | |
| Year 6 Only – Interest | |
| 188,105.65 | |
| Year 6 – Cumulative Interest | |
| 4,814,718.38 | |
Assumptions
- Land availability
- Consistent market conditions
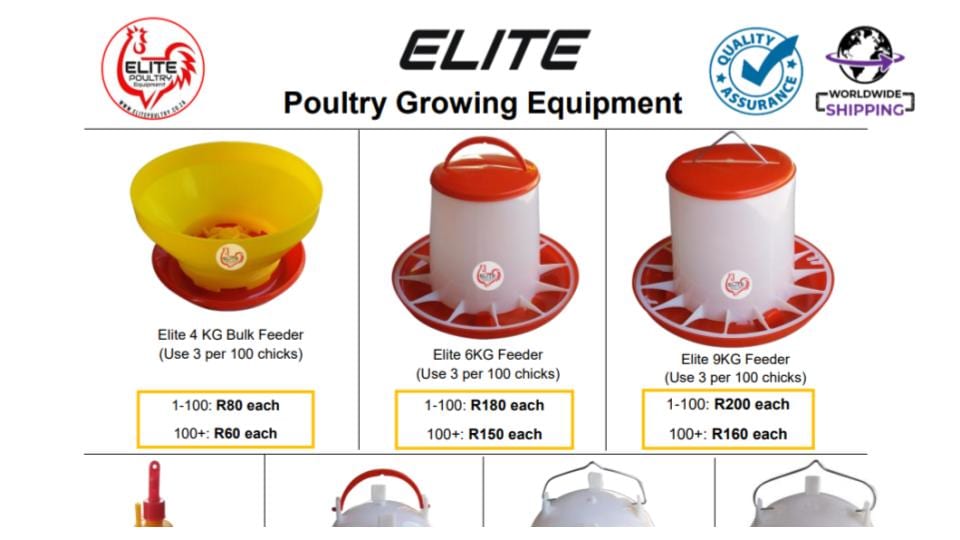
Annexure
Supplier quote for poultry equipment
Now, over to you…
Are you currently writing a poultry farm proposal?
Do you have plans for expansion or diversification of your poultry business?
Either way, I’d be interested to hear from you.
*Remember: print off the PDF by clicking the button at the start…
And then,
Leave me a comment below.
good day
this article cannot be downloaded as pdf.
kindly help please
Hello,
Thanks for letting me know – all sorted now. Sorry about the hitch.
Keep me posted.
Speak soon,
Temi
outstanding
I can’t download pdf.
please help.
This is interesting sample poultry proposal and please can you share me to may email:- aregawi1921@outlook.com